Phi in Music Perception
27/02/12 15:07
Of all the mysteries of the world, our human ability to recognize and enjoy music must be one of the greatest. How is it we are able to organically measure the degree of dissonance and mentally anticipate the direction of resolution in music harmony?
Most cognitive psychologists today believe that music is simply a matter of cultural conditioning. They claim no “out of the box” recognition of music, instead suggesting we recognize music only from the musical patterns we learn at an early age. Yet, the latest neurophysiological studies have found just the opposite – a preexisting pattern in our ears actually does help us focus and interpret music before sound even reaches the brain. And not surprisingly, it has a lot to do with the Divine Proportion.
Known as the Gaussian derivative distribution, this pattern is found in both sound and the human body. It can be visualized in sound by using a Blackman spectral analysis of two tones (as dark blue lines) diverging at a constant speed over an octave (Fig. 1).

Figure 1. Blackman spectral analysis as Gaussian derivative distribution.
In the analysis, the gaps identify simple whole number proportions that have been considered pleasing to the human ear for thousands of years. The relative size and spacing of the gaps actually follow a Gaussian first derivative distribution, peaking at the most resonant musical interval of a major sixth. [1] Graphed as a curve (in red), this equation measures the distribution of resonance over an octave by measuring the interference velocity of any two intervals. We are able to recognize this distribution for one reason – the very same pattern exists in the human body.
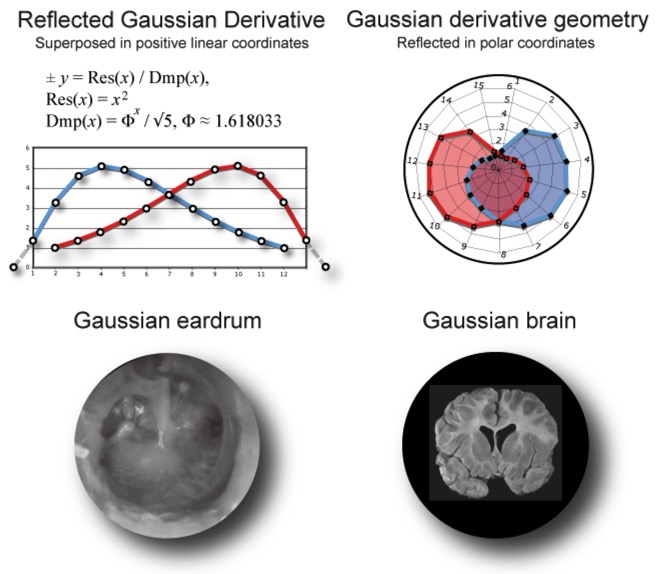
When graphed in polar coordinates and reflected symmetrically, the Gaussian derivative pattern can be found in the human rib cage, the apple shape of the face and distribution of color cones on the retina, to name just a few. [2, 3] We even find it in the shape of the human eardrum and brain (Fig. 2).

Figure 2. Gaussian derivative geometry of the eardrum and brain.
When expressed in terms of Phi rather than the base of the natural log, the Gaussian derivative measures the distribution of harmonic resonance in the human anatomy. For instance, the central stem or Malleus of the eardrum corresponds to the consonant unison and octave of the spectral pattern while the Stapes and Incus bones meet at the highly resonant major sixth. Evolved to measure opposite ends of the resonant spectrum, the bones of the middle ear transform musical intervals from compression wave patterns into transverse waves that travel into the inner ear. Thus, our first perception of music depends entirely on the Gaussian pattern evolved into our eardrum.
Inside the spiraling cochlea of the inner ear, tiny hairs on the Organ of Corti in the Basilar membrane bend around stable resonance patterns to help focus incoming sound into the recognizable fringe of a Gaussian curve. [4, 5] In fact, the Basilar membrane might well be described as a coiled up version of the Blackman spectral pattern that works to emphasize simple harmonic proportions over incoherent noise.
From here, sound is transformed again, this time into neural “action potential” impulses that propagate into the Gaussian neural net of the brain. Impulse waves pass through three concentric rings of the Brodmann Area in order to further identify and interpret music. The outer ring measures frequency and loudness, the middle ring measures melody, harmony and rhythmic patterns and the third ring integrates everything into the musical experience. Once again, it all takes place is inside the geometry of a reflected Gaussian derivative, relying on Phi as the organizational constant to recognize the essential elements of sound and music.
Far more than cultural conditioning, we humans recognize harmonic patterns in sound because the body itself is a harmonic pattern. From the Fibonacci helix of our outer ears to the spiraling cochlea of the inner ear to the harmonic rings inside our brain, recognition and enjoyment of music depends on the Divine Proportion as a shared property in both music and physiology.
Bibliography
1. Merrick R.S., “Interference: A Grand Scientific Musical Theory,” (self-published), Fairview, Texas, 2009. ISBN: 978-0-615-20599-1.
2. Merrick R.S., “Harmonically Guided Evolution,” Proceedings of the Natural Philosophy Alliance, Volume 7, June 2010.
3. Meyer, W.W., (2001) “The Gaussian derivative model for spatial-temporal vision: I. Cortical Model,” Spatial vision (Spat. vis.) ISSN 0169-1015, 2001, vol. 14, no 3-4 (5 p.), pp. 261-319.
4. Wrigley S.N., Brown GJ. (2003), “A Neural Oscillator Model of Auditory Selective Attention,” Department of Computer Science, University of Sheffield, UK. • Young, R.A., Lesperance RM,
5. X Janata, P., Birk, J.L., Van Horn, J.D., Leman, M., Tillmann, B., Bharucha, J.J., “The Cortical Topography of Tonal Structures Underlying Western Music,” Science 13 December 2002, Vol. 298. No. 5601. Pp. 2167 - 2170.
6. Rothenberg, D., “A Model for Pattern Perception with Musical Applications Part I: Pitch Structures as order-preserving maps,” Mathematical Systems Theory 11 (1978) 199-234.
Most cognitive psychologists today believe that music is simply a matter of cultural conditioning. They claim no “out of the box” recognition of music, instead suggesting we recognize music only from the musical patterns we learn at an early age. Yet, the latest neurophysiological studies have found just the opposite – a preexisting pattern in our ears actually does help us focus and interpret music before sound even reaches the brain. And not surprisingly, it has a lot to do with the Divine Proportion.
Known as the Gaussian derivative distribution, this pattern is found in both sound and the human body. It can be visualized in sound by using a Blackman spectral analysis of two tones (as dark blue lines) diverging at a constant speed over an octave (Fig. 1).

Figure 1. Blackman spectral analysis as Gaussian derivative distribution.
In the analysis, the gaps identify simple whole number proportions that have been considered pleasing to the human ear for thousands of years. The relative size and spacing of the gaps actually follow a Gaussian first derivative distribution, peaking at the most resonant musical interval of a major sixth. [1] Graphed as a curve (in red), this equation measures the distribution of resonance over an octave by measuring the interference velocity of any two intervals. We are able to recognize this distribution for one reason – the very same pattern exists in the human body.
When graphed in polar coordinates and reflected symmetrically, the Gaussian derivative pattern can be found in the human rib cage, the apple shape of the face and distribution of color cones on the retina, to name just a few. [2, 3] We even find it in the shape of the human eardrum and brain (Fig. 2).

Figure 2. Gaussian derivative geometry of the eardrum and brain.
When expressed in terms of Phi rather than the base of the natural log, the Gaussian derivative measures the distribution of harmonic resonance in the human anatomy. For instance, the central stem or Malleus of the eardrum corresponds to the consonant unison and octave of the spectral pattern while the Stapes and Incus bones meet at the highly resonant major sixth. Evolved to measure opposite ends of the resonant spectrum, the bones of the middle ear transform musical intervals from compression wave patterns into transverse waves that travel into the inner ear. Thus, our first perception of music depends entirely on the Gaussian pattern evolved into our eardrum.
Inside the spiraling cochlea of the inner ear, tiny hairs on the Organ of Corti in the Basilar membrane bend around stable resonance patterns to help focus incoming sound into the recognizable fringe of a Gaussian curve. [4, 5] In fact, the Basilar membrane might well be described as a coiled up version of the Blackman spectral pattern that works to emphasize simple harmonic proportions over incoherent noise.
From here, sound is transformed again, this time into neural “action potential” impulses that propagate into the Gaussian neural net of the brain. Impulse waves pass through three concentric rings of the Brodmann Area in order to further identify and interpret music. The outer ring measures frequency and loudness, the middle ring measures melody, harmony and rhythmic patterns and the third ring integrates everything into the musical experience. Once again, it all takes place is inside the geometry of a reflected Gaussian derivative, relying on Phi as the organizational constant to recognize the essential elements of sound and music.
Far more than cultural conditioning, we humans recognize harmonic patterns in sound because the body itself is a harmonic pattern. From the Fibonacci helix of our outer ears to the spiraling cochlea of the inner ear to the harmonic rings inside our brain, recognition and enjoyment of music depends on the Divine Proportion as a shared property in both music and physiology.
Bibliography
1. Merrick R.S., “Interference: A Grand Scientific Musical Theory,” (self-published), Fairview, Texas, 2009. ISBN: 978-0-615-20599-1.
2. Merrick R.S., “Harmonically Guided Evolution,” Proceedings of the Natural Philosophy Alliance, Volume 7, June 2010.
3. Meyer, W.W., (2001) “The Gaussian derivative model for spatial-temporal vision: I. Cortical Model,” Spatial vision (Spat. vis.) ISSN 0169-1015, 2001, vol. 14, no 3-4 (5 p.), pp. 261-319.
4. Wrigley S.N., Brown GJ. (2003), “A Neural Oscillator Model of Auditory Selective Attention,” Department of Computer Science, University of Sheffield, UK. • Young, R.A., Lesperance RM,
5. X Janata, P., Birk, J.L., Van Horn, J.D., Leman, M., Tillmann, B., Bharucha, J.J., “The Cortical Topography of Tonal Structures Underlying Western Music,” Science 13 December 2002, Vol. 298. No. 5601. Pp. 2167 - 2170.
6. Rothenberg, D., “A Model for Pattern Perception with Musical Applications Part I: Pitch Structures as order-preserving maps,” Mathematical Systems Theory 11 (1978) 199-234.


